6 Elasticity
Objectives
- Compute price, cross-price, and income elasticity of demand
- Understand how price elasticity of demand changes with outside factors
- Compute price elasticity of supply
- Understand how price elasticity of supply changes with outside factors
This section creates measures of elasticity, which measures how responsive demand and supply curves are to a change in price.
6.1 Price Elasticity
We first develop the price elasticity of demand, our measure of how responsive the demand curve is to changes in price. We start with a change in price, which leads to a change in quantity demanded. We compute the price elasticity as the absolute value of the percentage change in quantity demanded, divided by the percentage change in price.
This formula is unique for 1) using percentage change and 2) using absolute value. We use percentage change because it is removes scale. A 20% increase in the price of bread in New York would lead to a change in quantity demanded at the scale of millions per year. In contrast, a 20% increase in the price of bread at a single store would only lead to a change in quantity demanded at the scale of thousands per year. Taking the percentage change allows us to scale the demand curve so that we can compare small and large towns, different size stores, etc.
We take the absolute value because it makes our elasticity measure positive. The law of demand states that a price increase leads to a quantity demanded decrease, so the initial fraction is negative. More responsive customers that decrease consumption by a larger amount would have a more negative elasticity. Taking the absolute value makes more responsive customers have a ‘higher’ positive elasticity number.
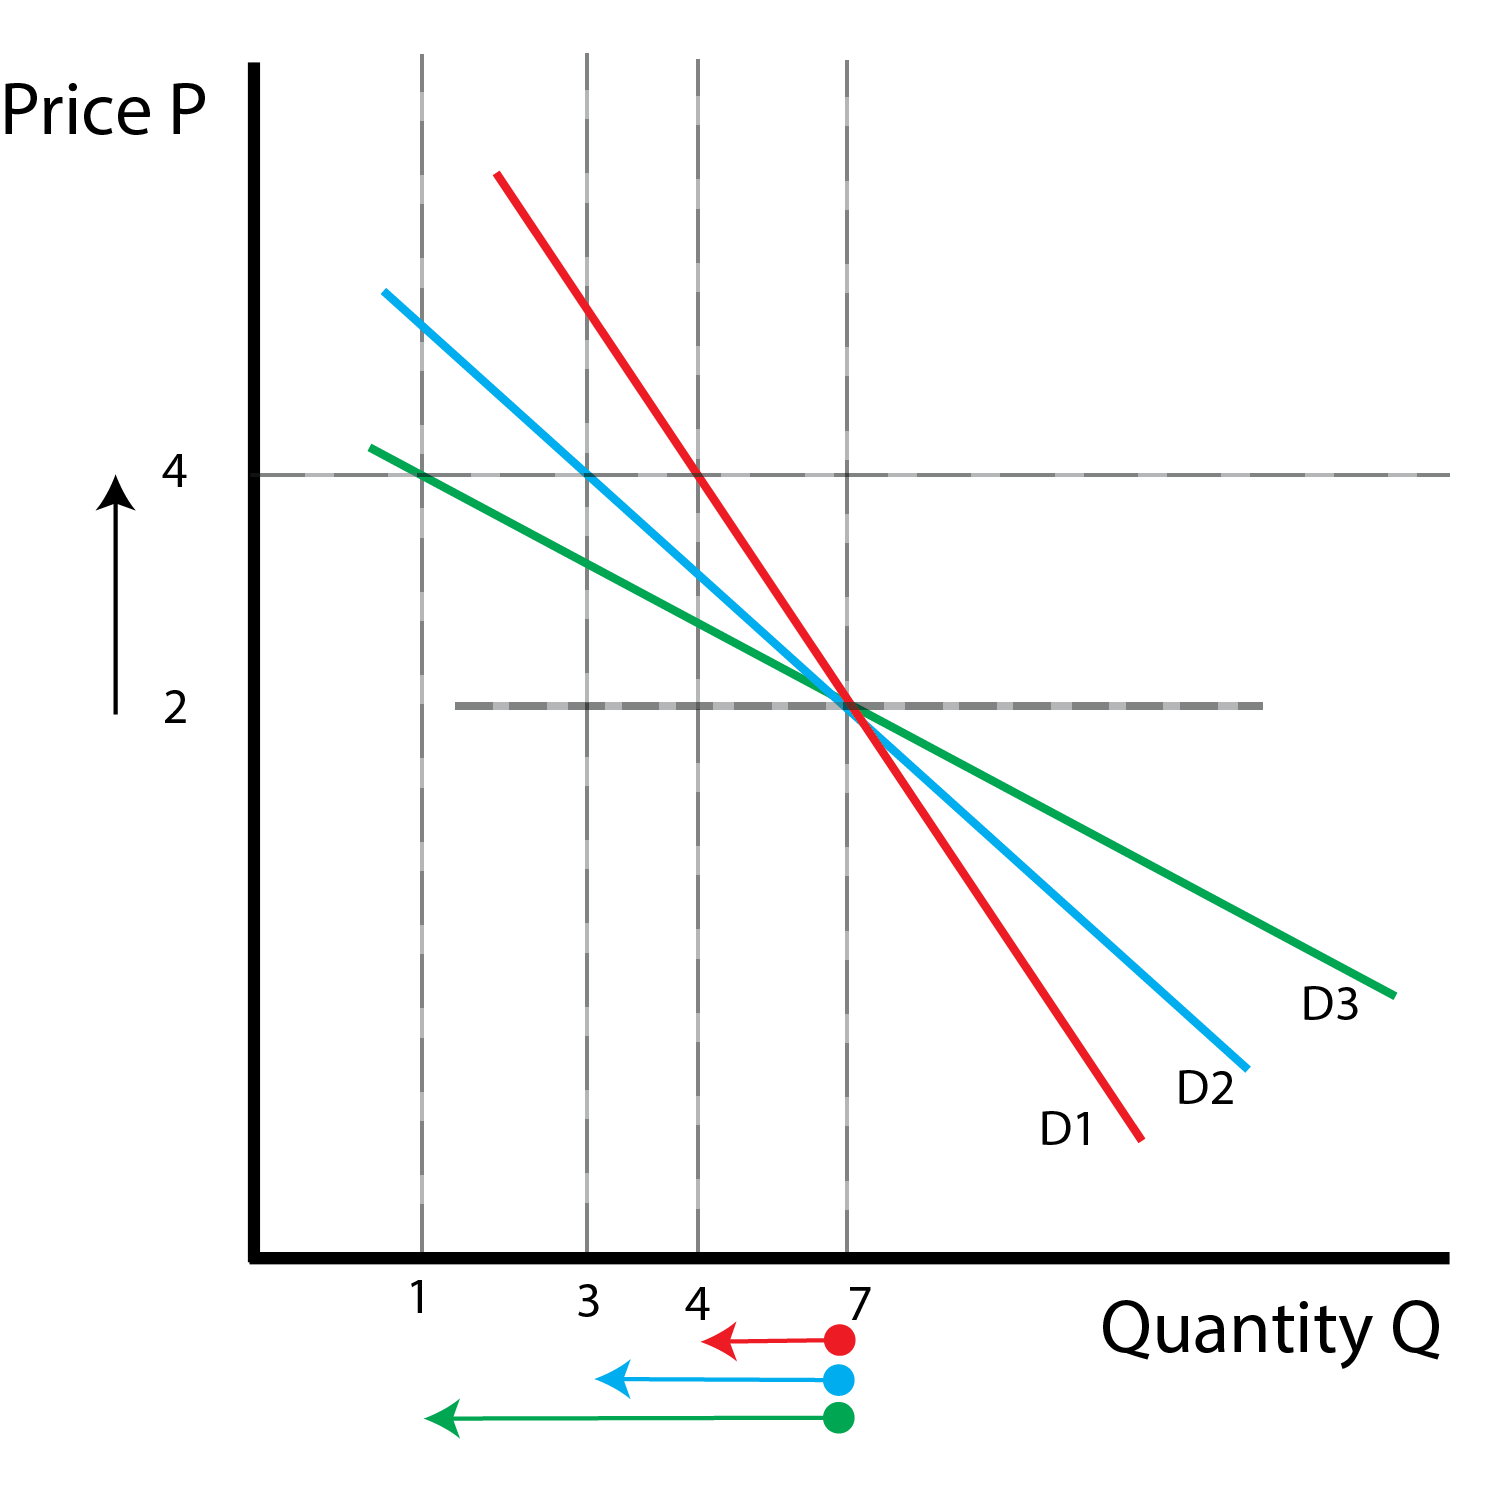
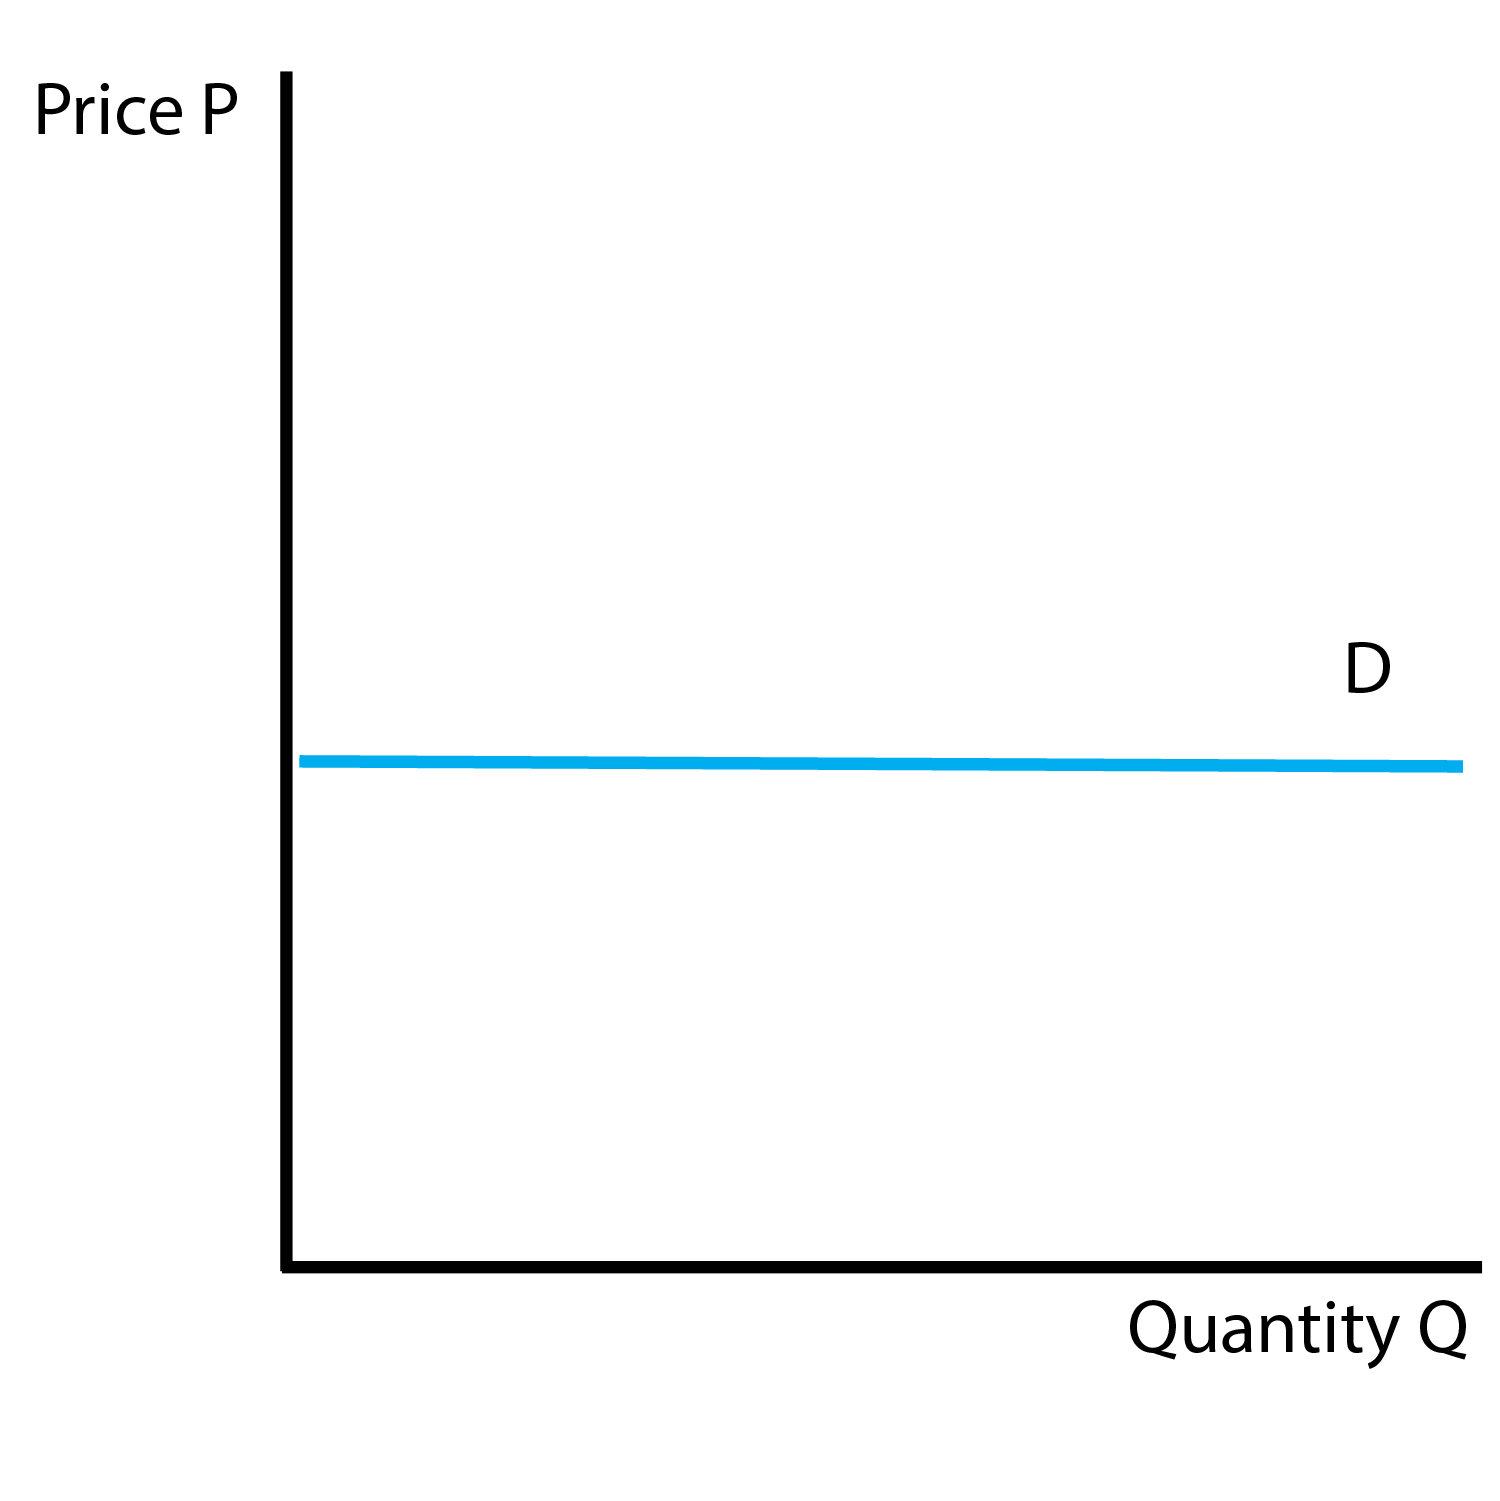
We now examine different levels of elasticity:
| Demand Type | Elasticity Value |
|---|---|
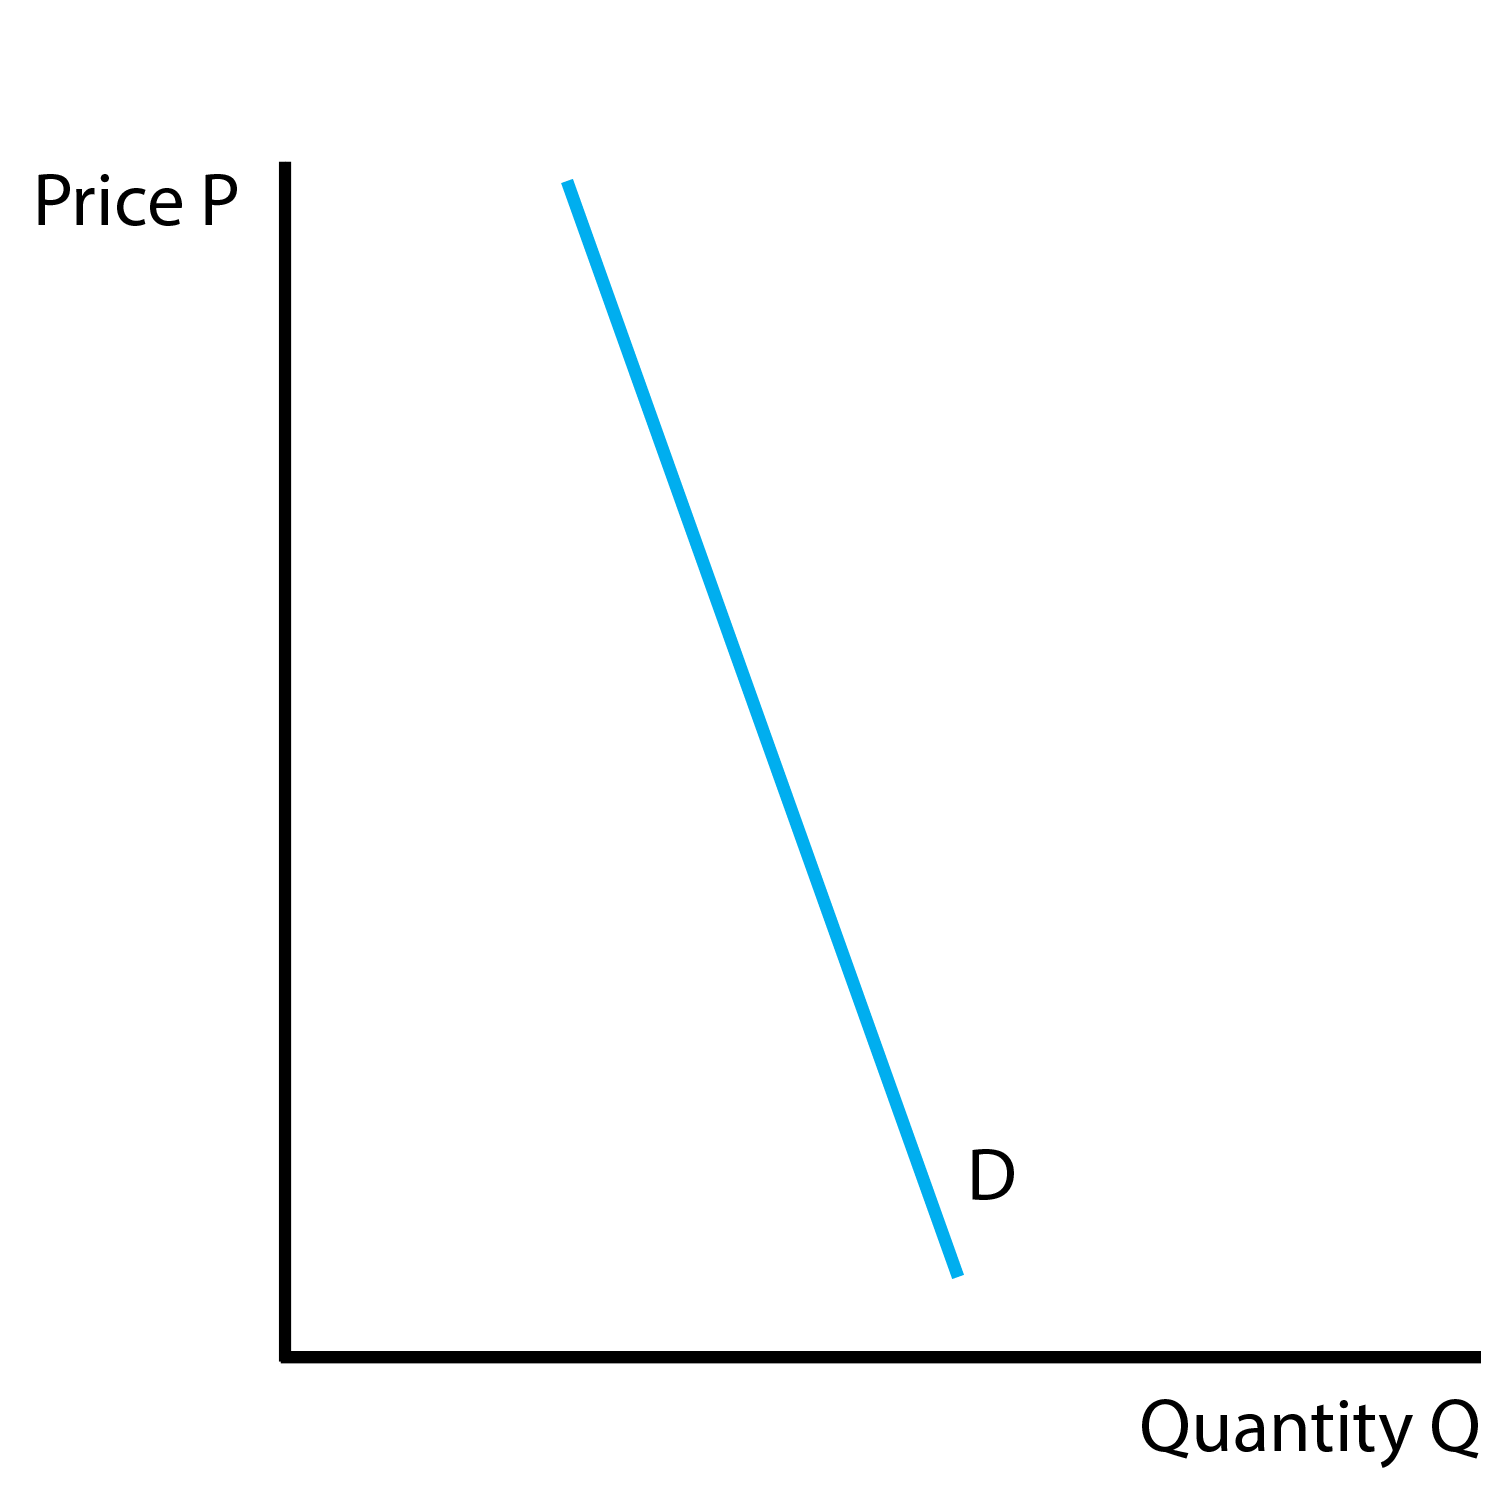
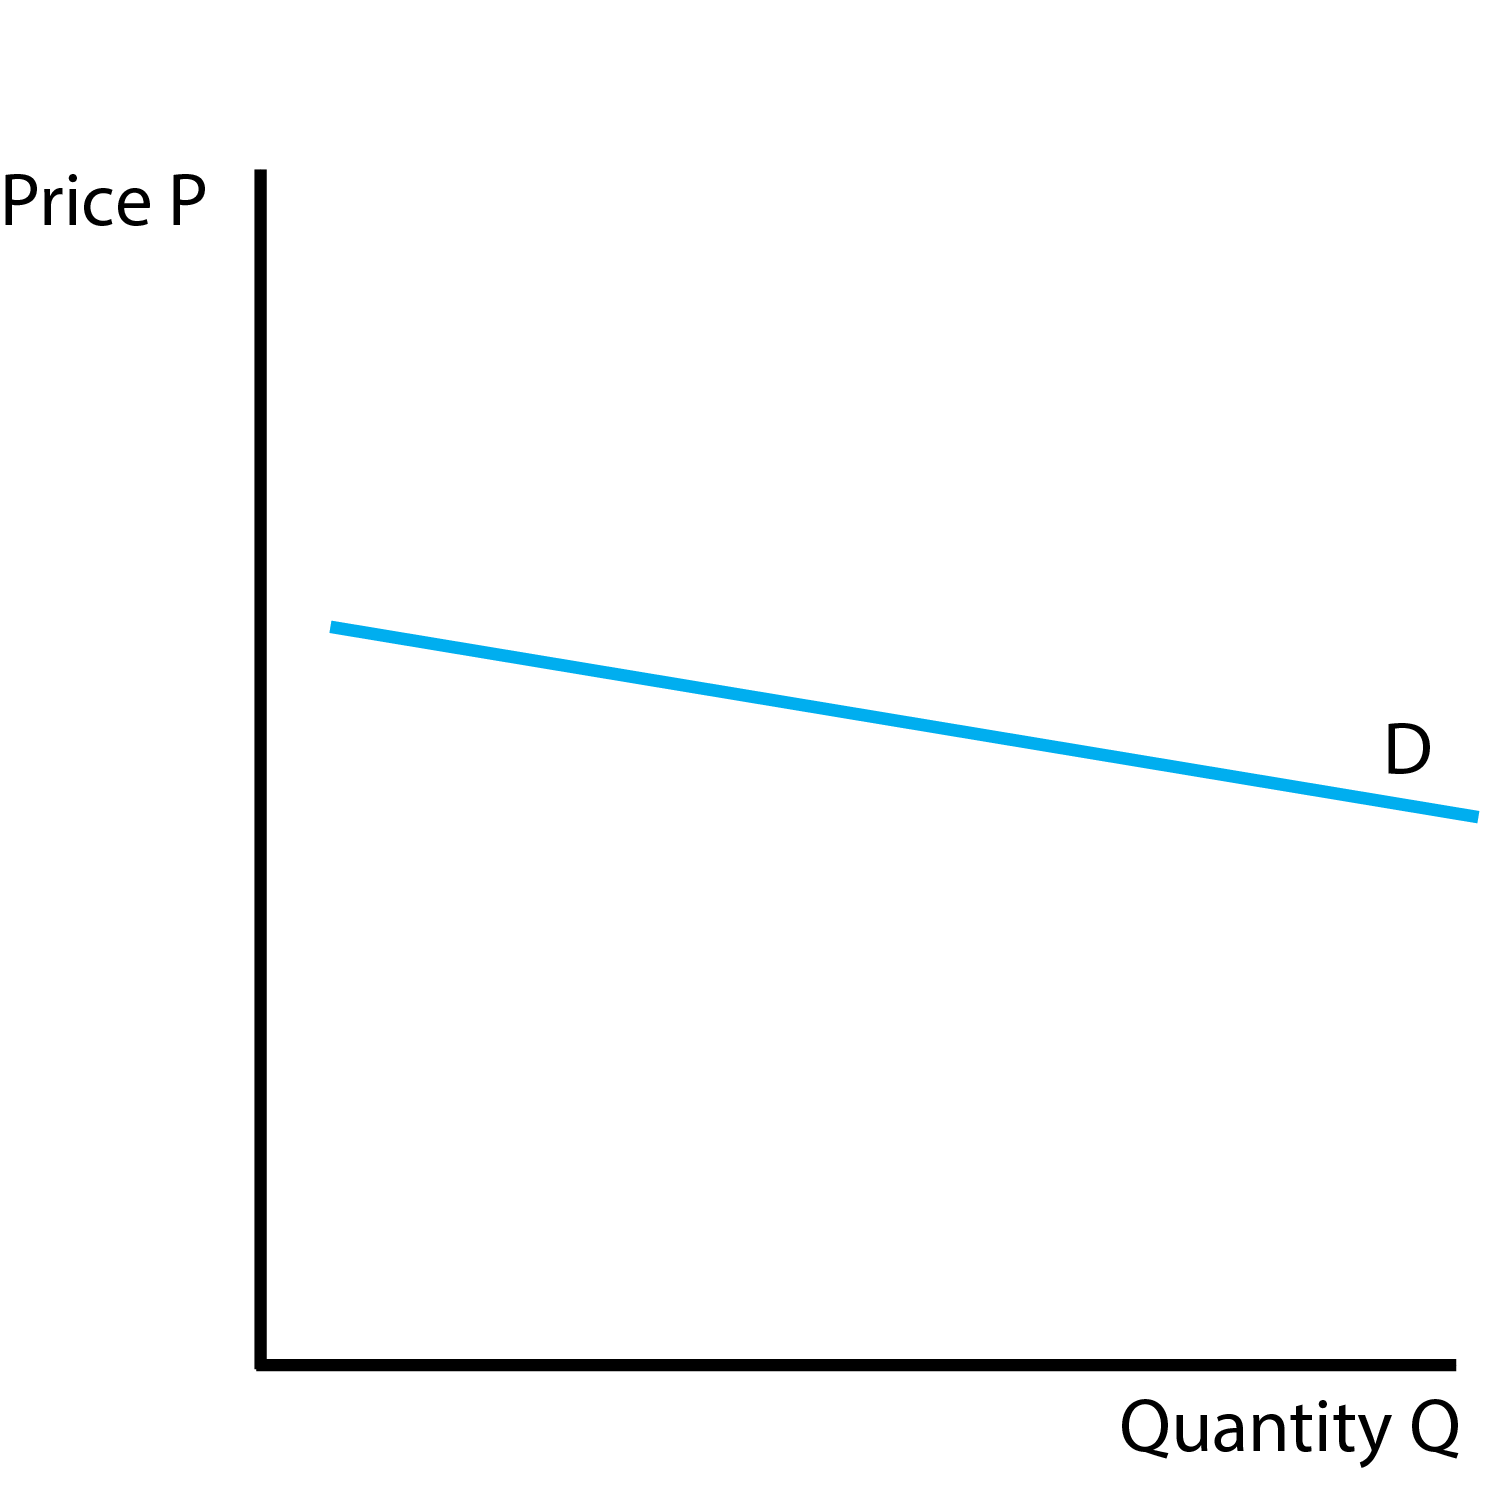
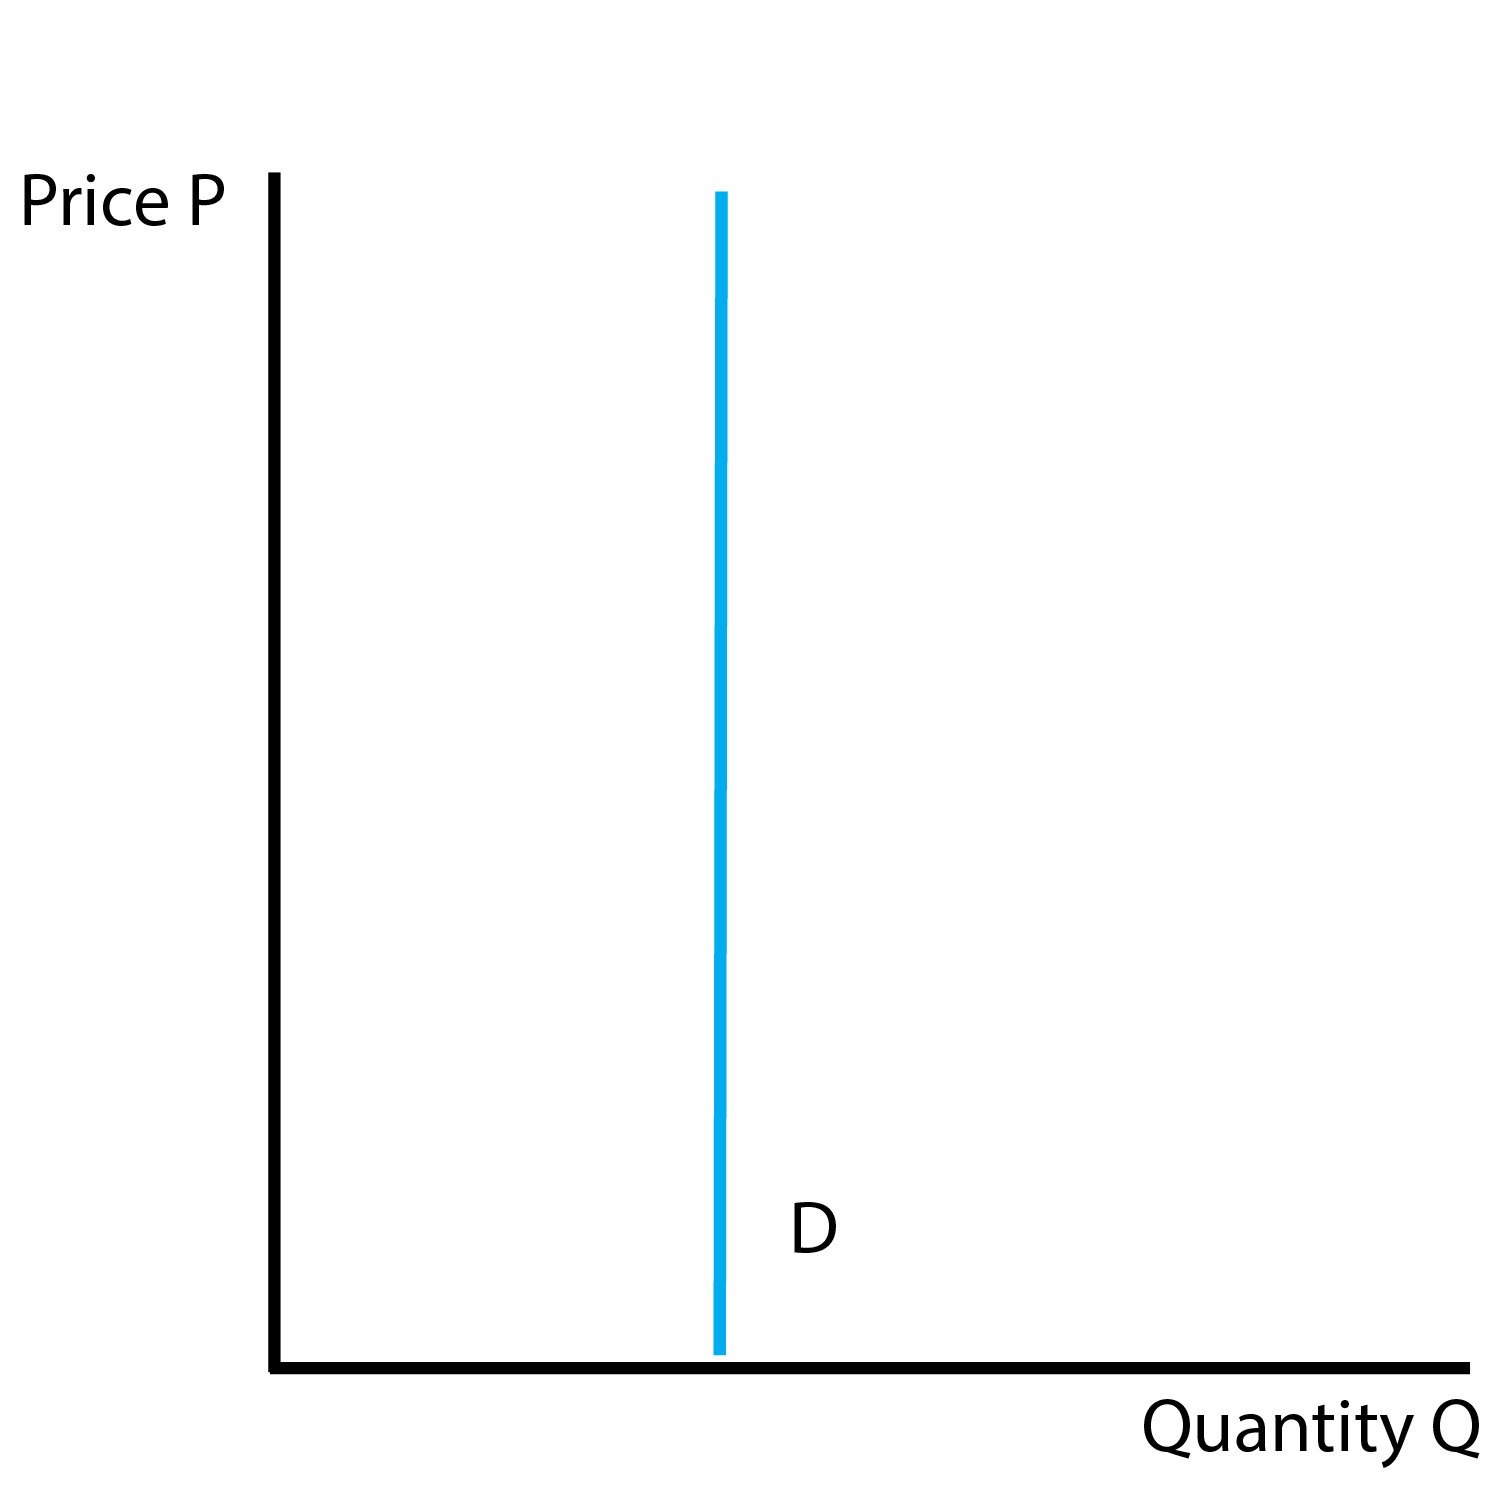
| Perfectly Inelastic | 0 (Horizontal) |
| Inelastic | < 1 |
| Unit Elastic | = 1 |
| Elastic | > 1 |
| Perfectly Elastic | Infinity (Vertical) |
6.2 Cross Price Elasticity of Demand
This section develops the Cross Price Elasticity of Demand which measures the responsiveness of the demand curve with respect to another good. Note we don’t include the absolute value because the sign of the cross price elasticity will have meaning.
We consider two cases: substitutes and complements. Consider the substitutes Coke and Pepsi. If the price of Coke increases, some consumers will switch to Pepsi, increasing the quantity demanded for Pepsi. For the cross-price elasticity, we have a positive change in Coke’s price and a positive change in Pepsi’s quantity demanded. Our cross-price elasticity is therefore positive. Consider the complements hot-dogs and hot-dog buns. If the price of hot-dogs increases, the ‘bundle’ becomes more expensive, so we have a lower quantity demanded for hot-dog buns. For the cross-price elasticity, we have a positive change in price and negative change in quantity demanded. Our cross-price elasticity is therefore negative.
| Cross Price Elasticity | Sign |
|---|---|
| Substitutes | Positive |
| Complements | Negative |
Excluding the absolute value is helpful because we can infer whether products are complements or substitutes based on the sign of the cross-price elasticity.
6.3 Income Elasticity
This section develops the income elasticity of demand, which measures the responsiveness of the demand curve with respect to income.
| Income Elasticity | Sign |
|---|---|
| Normal | Positive |
| Inferior | Negative |
For a normal good, when income rises, the quantity demanded also rises, resulting in a positive income elasticity. For an inferior good, when income rises, the quantity demanded falls, resulting in a negative income elasticity. The sign of the income elasticity tells us whether a good is normal (positive) or inferior (negative), just as with cross-price elasticity and the relationship between substitutes and complements.
6.4 Determinants
| Determinant | Description | Explanation |
|---|---|---|
| Competing Products | More substitutes lead to higher elasticity | Consumers have more products that can substitute |
| Specific Brands | Specific brands tend to have higher elasticity compared to categories | Easier to substitute across brands than categories |
| Necessities | Necessities tend to have lower elasticity | Hard to substitute away from necessities such as water |
| Consumer Search | Elasticity increases as consumers search more | Consumers find more competing substitutes |
| Time | Elasticity increases over time | Consumers have more time to search for substitutes |
6.5 Price Elasticity of Supply
This section develops the price elasticity of supply, which measures the responsiveness of the supply curve. The price elasticity of supply divides the percentage change in quantity supplied by the percentage change in price. Notice we don’t include absolute values, because the law of supply implies this ratio will always be positive.
| Determinant | Explanation |
|---|---|
| Inventory | Firms with more inventory can respond quickly to price changes, increasing elasticity. |
| Variable Inputs | If inputs can be easily varied, firms can adjust supply more readily, increasing elasticity. |
| Capacity | Greater production capacity allows firms to increase supply when prices rise, increasing elasticity. |
| Entry and Exit | Easier entry and exit of firms in the market makes supply more elastic. |
| Time | Supply becomes more elastic over time as firms adjust production processes and resources. |
6.6 Conclusion
- This lecture develops the elasticity, a measure of how responsive demand and supply are
- We develop the price elasticity, which measures responsiveness to price
- We develop the elasticity to other factors (income, other prices)
- We develop elasticity ‘shifters’ from other factors (time, necessities)