2 Demand
Objectives
- Know the definition of the demand curve
- Identify movements along the demand curve vs. shifts of the demand curve
- Know common shifts of the demand curve
- Income
- Other Goods
- Expectations
- Know the relationship between the demand curve and the marginal benefit curve
- Be able to compute the market demand curve
2.1 Introduction
This section introduces the demand curve, which comes from the consumer problem of how much of something we should buy. Our decision depends on many different factors: the price, income, our tastes, what our friends are doing, the news, the weather. The demand curves isolates the relationship between the price and quantity demanded, and holds everything else constant.
2.2 Movements Along the Demand Curve
We now introduce the two movements along the demand curve. This includes two cases: a decrease in the price and an increase in the price.
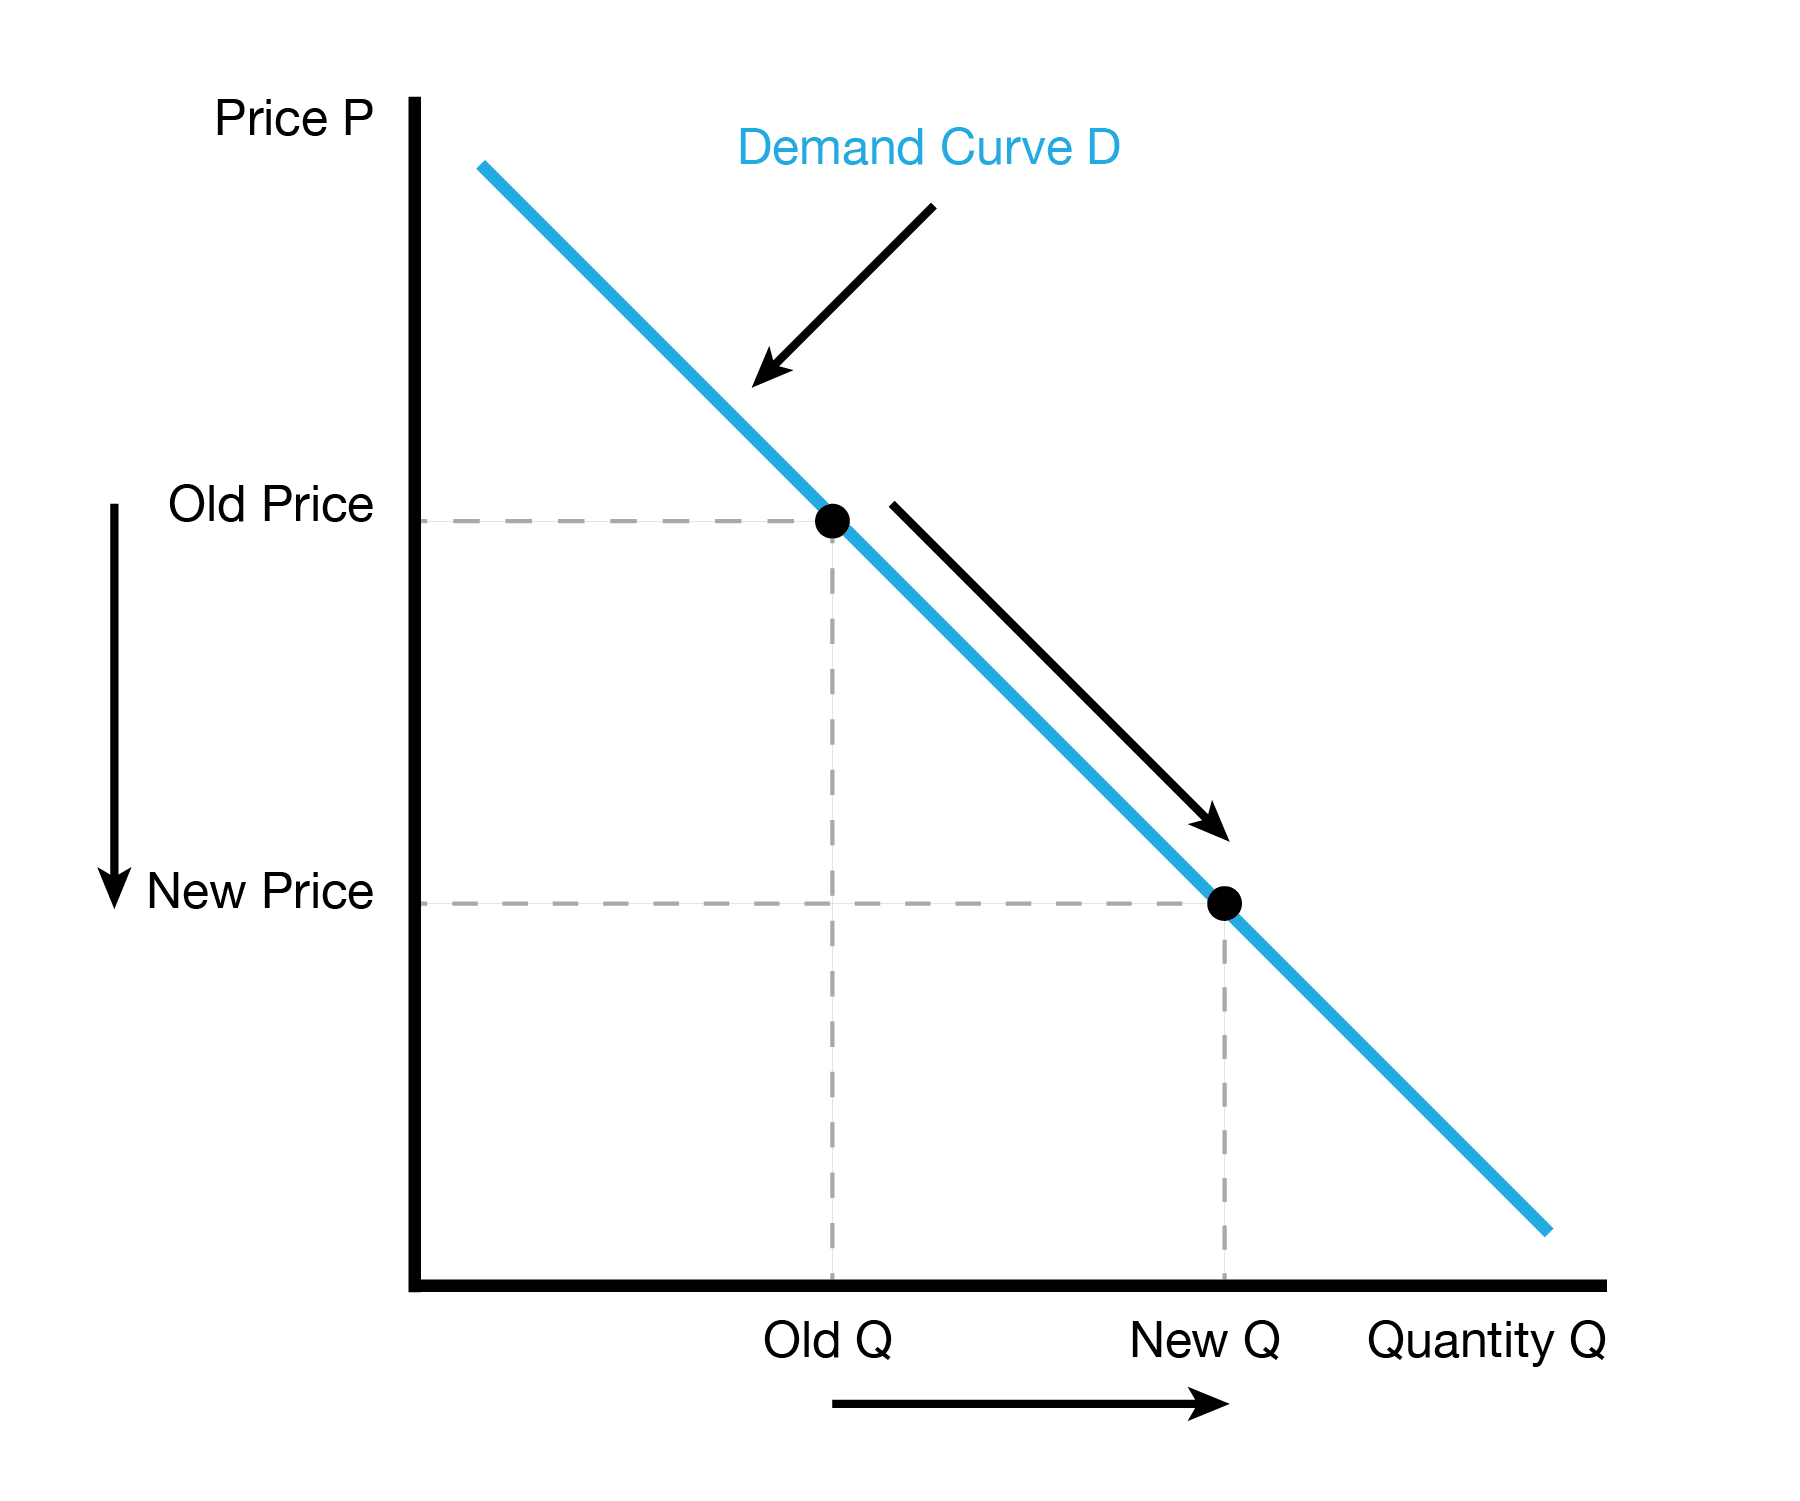
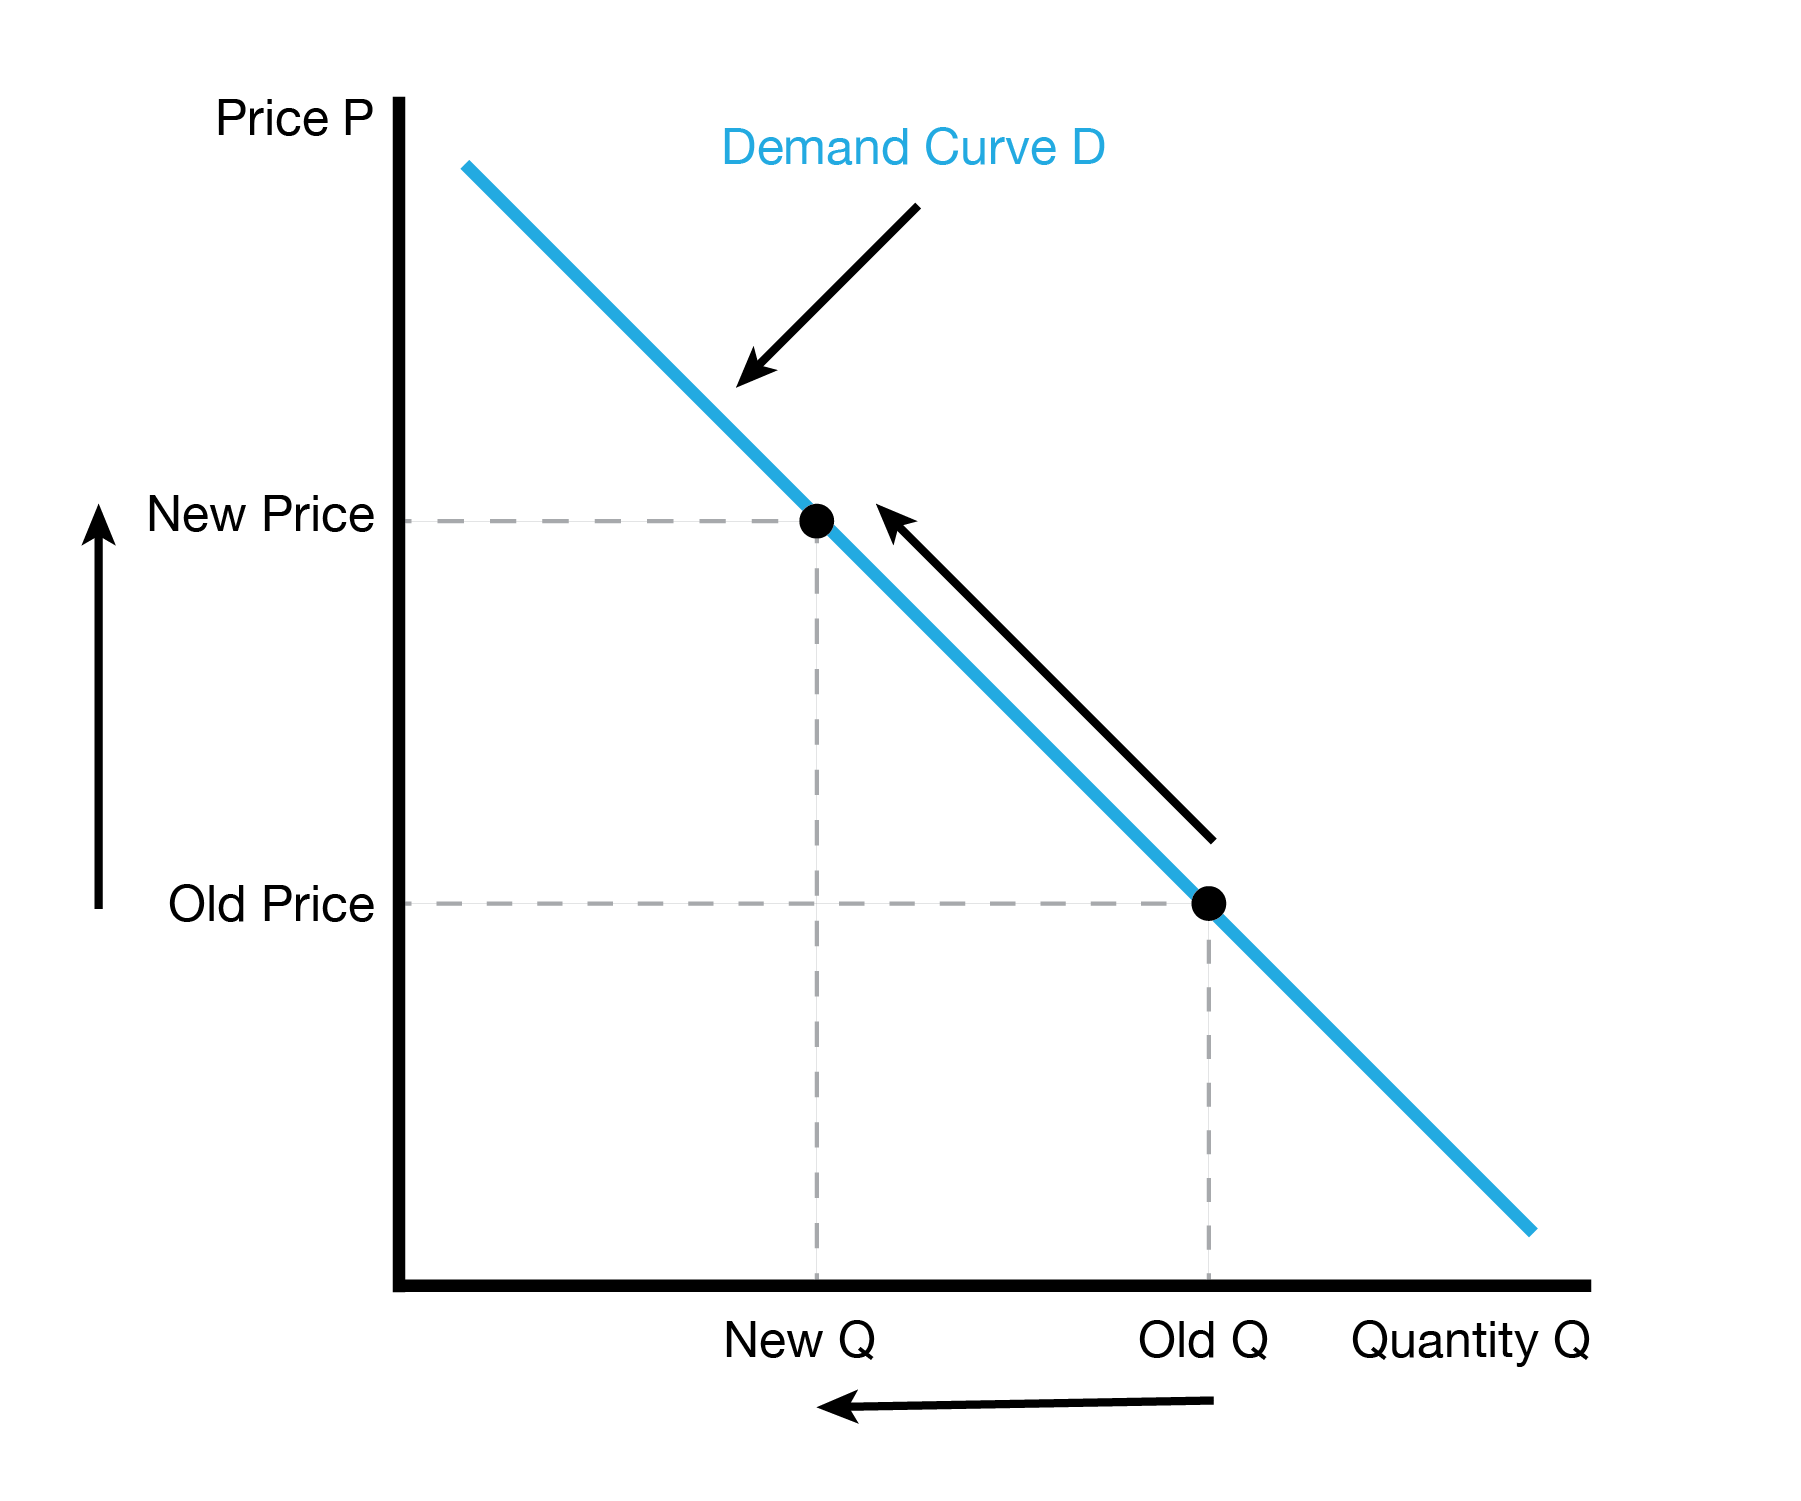
Changes in Quantity Demanded
2.3 Shifts of the Demand Curve
We now study what happens when ‘everything else’ changes. If we have a price change and want to study how our quantity demanded changes, we simply trace along the demand curve. When something else changes, we can no longer simply trace along the demand curve. In fact, the entire demand curve will shifts. This occurs because our quantity demanded changes at every price due to the outside factor.
There are two types of demand shifts: an increase in demand and a decrease in demand. When we have an increase in demand, we want to buy more of the good at every price. When we have a decrease in demand, we want to buy less of the good at every price. Note that on the graph, an increase in demand shifts the demand curve to the right, while a decrease in demand shifts the demand curve to the left. This differs from our usual intuition of a shift up or down.
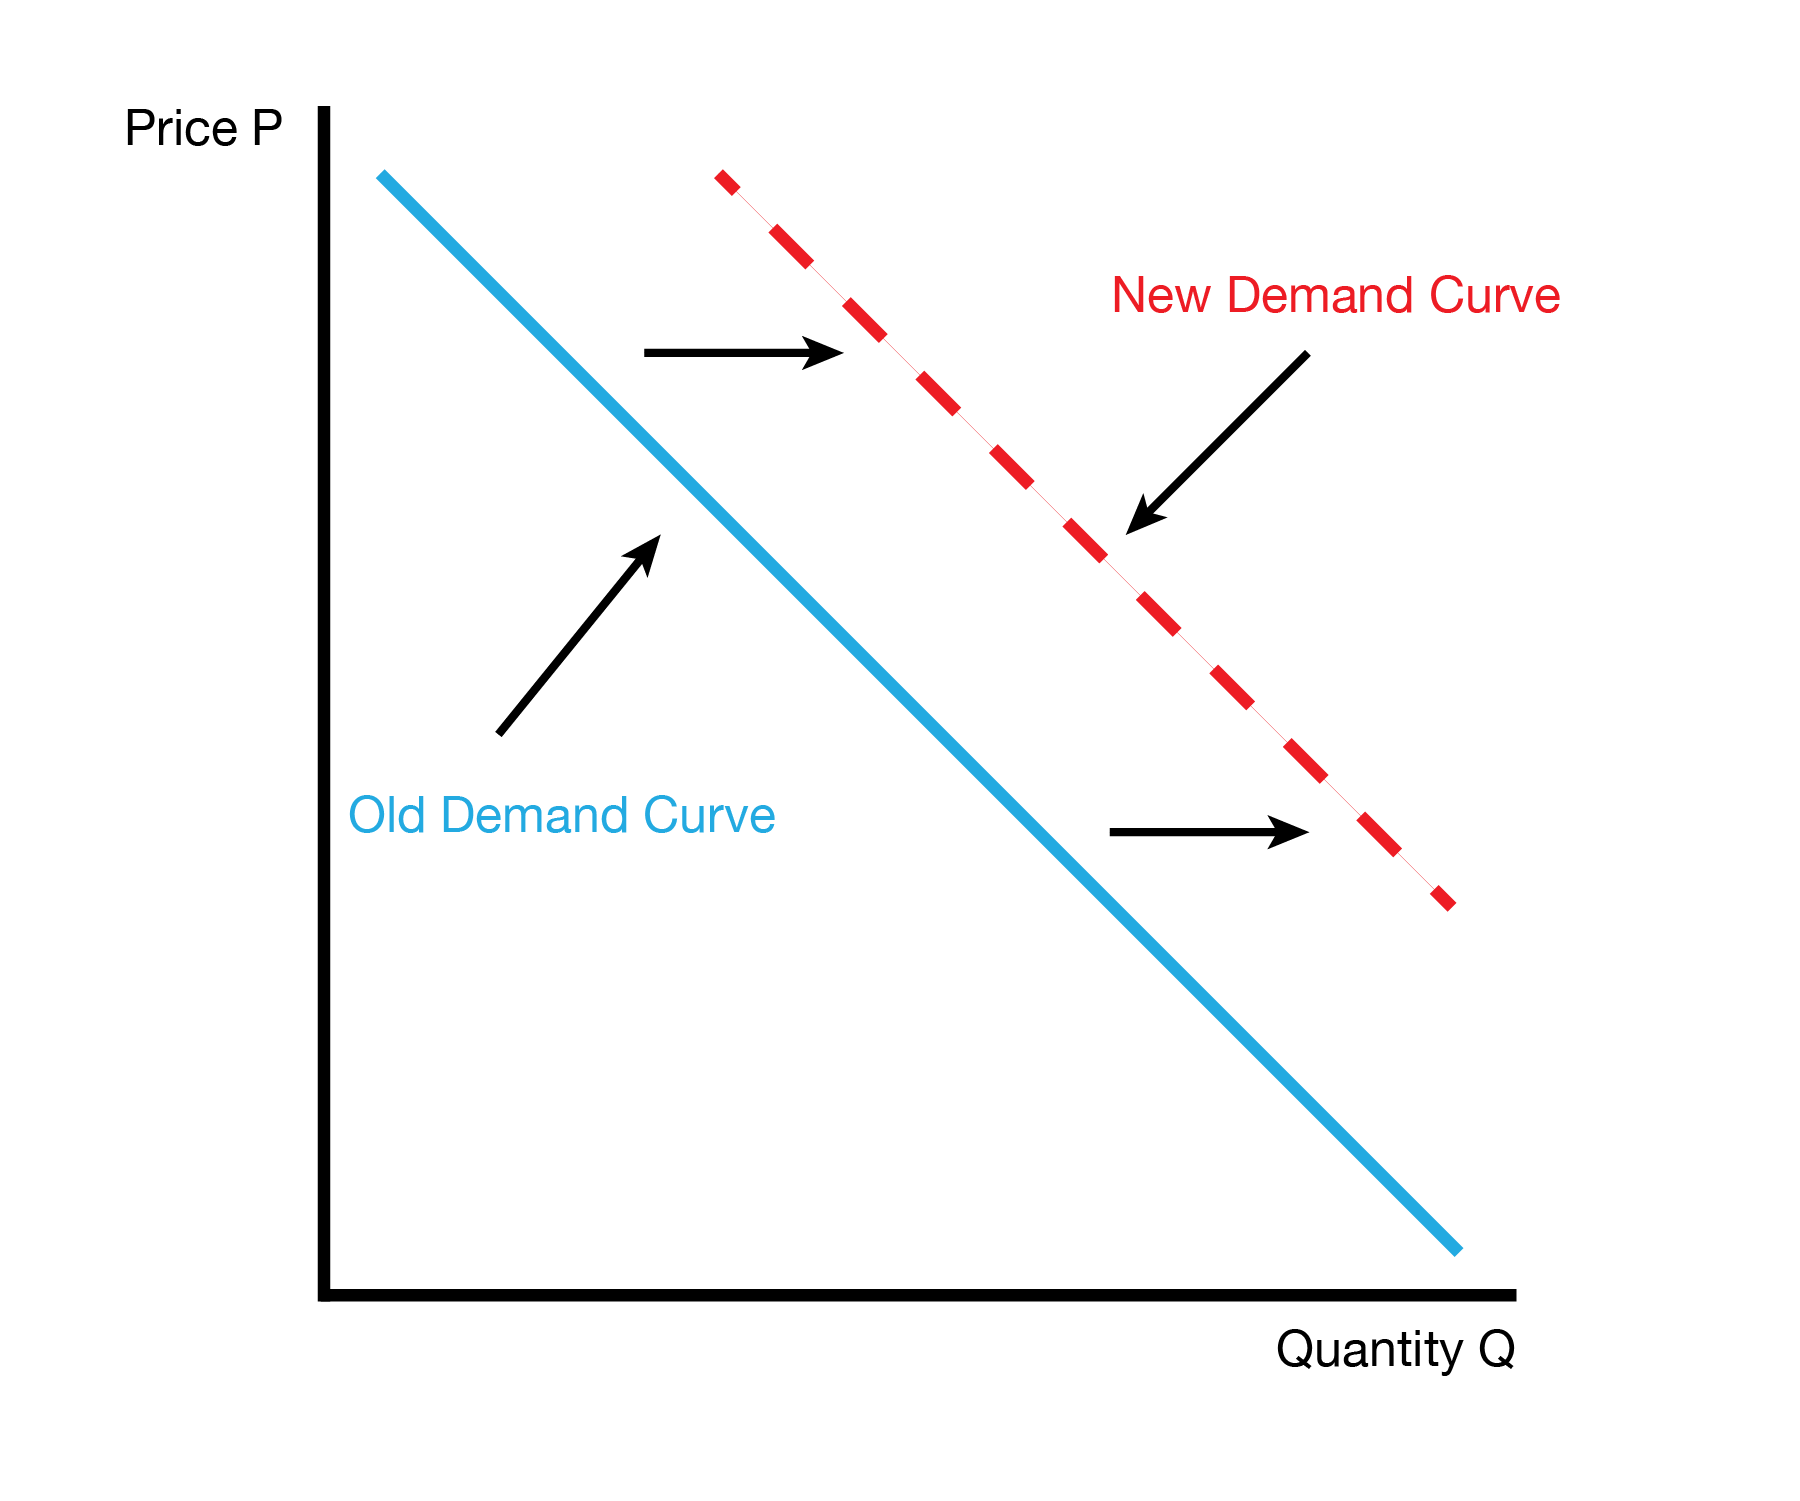
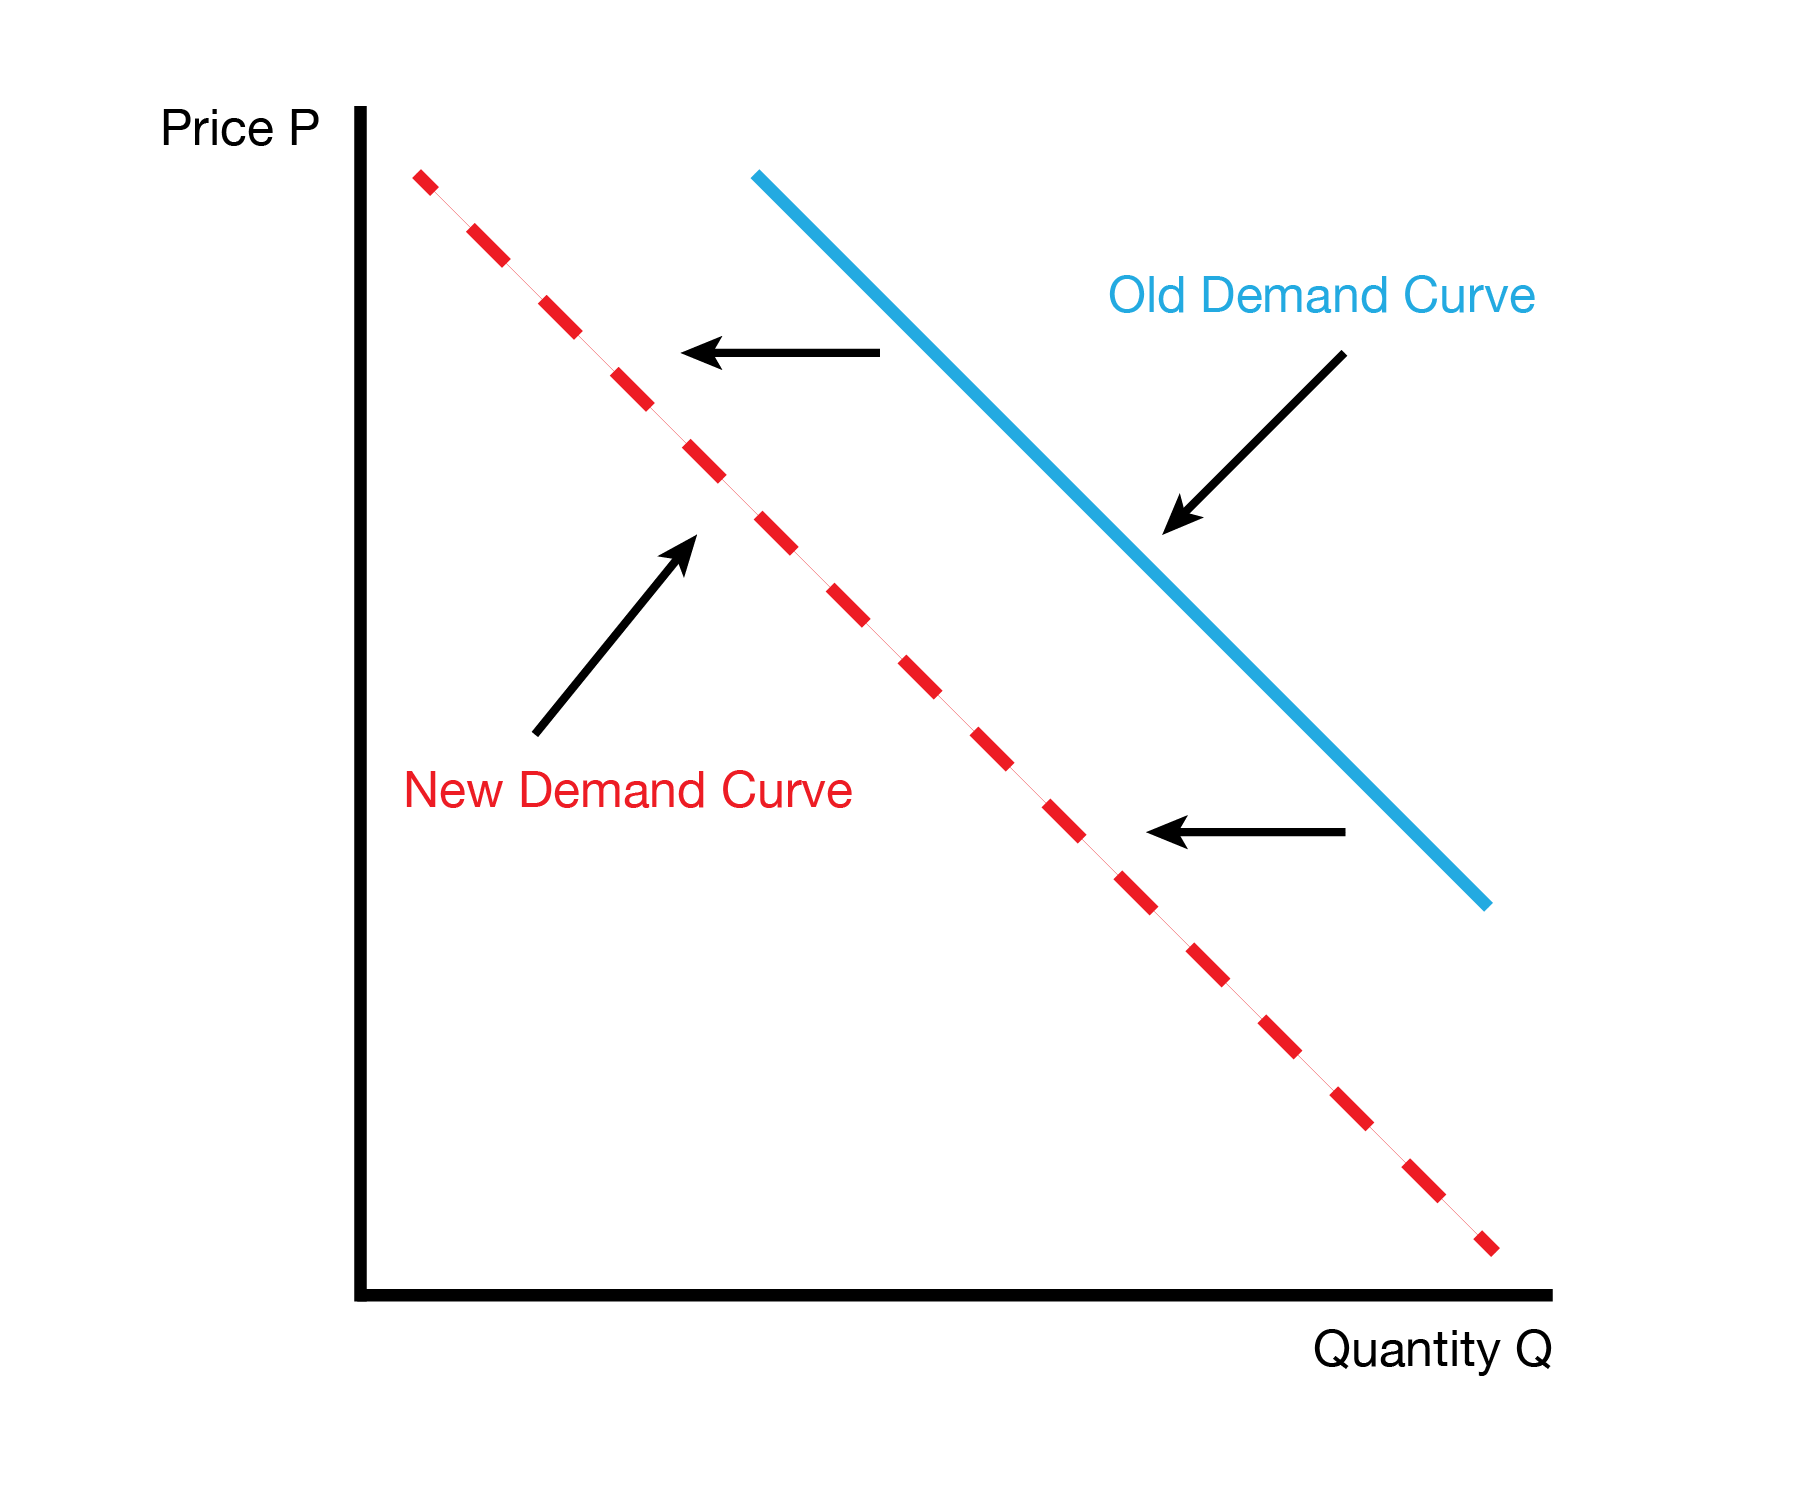
Demand Shifts
2.3.1 Income: Normal and Inferior Goods
Our demand for a good can depend on our income. We classify goods into two categories: normal goods and inferior goods. Normal goods are goods for which an increase in income leads to an increase in demand. Inferior goods are goods for which an increase in income leads to a decrease in demand.
An example of a normal good is restaurant meals. When our income increases, we tend to eat out more often. An example of an inferior good is instant noodles. When our income increases, we tend to eat instant noodles less often.
| Good | Change in Income | Change in Demand |
|---|---|---|
| Normal | Increases | Increases |
| Normal | Decreases | Decreases |
| Inferior | Increases | Decreases |
| Inferior | Decreases | Increases |
2.3.2 Other Prices: Substitutes and Complements
Our demand for a good can depend on the prices of other goods. We classify other goods into two categories: substitutes and complements. Substitute goods are goods that can replace each other. For example, butter and margarine are substitutes. If the price of butter increases, we will buy more margarine instead, which we interpret as an increase in the demand for margarine.
Complement goods are goods that are used together. For example, peanut butter and jelly are complements. If the price of peanut butter increases, we will buy less jelly, which we interpret as a decrease in the demand for jelly.
| Change | Demand |
|---|---|
| Price of Complement ↑ | Decreases |
| Price of Complement ↓ | Increases |
| Price of Substitute ↑ | Increases |
| Price of Substitute ↓ | Decreases |
2.3.3 Prices in the Future: Expectations
Our demand for a good can depend on our expectations about the future. It’s important to distinguish between our demand today and our demand tomorrow. Our generic demand curve refers to our demand today as a function of today’s price. When the price in the future changes, it can affect our demand today as an outside factor.
When we have a worse deal tomorrow, we want to buy more today, which increases today’s demand. When we have a better deal tomorrow, we want to buy less today, which decreases today’s demand.
| Change | Effect on Demand |
|---|---|
| Worse Deal Tomorrow | Increases Today |
| Better Deal Tomorrow | Decreases Today |
2.4 The Demand Curve and the Marginal Benefit Curve
One of the most important results in economics is that the demand curve is equal to the marginal benefit curve. This reason why is as follows: -Each point on the demand curve tells us the highest price someone is willing to pay for that extra unit. -That “willingness to pay” is exactly the marginal benefit—because it’s the value the consumer places on one more unit.
So, the demand curve is just a graph of marginal benefit: higher prices mean consumers will only buy if they get a lot of benefit, and lower prices mean even smaller benefits are worth it.
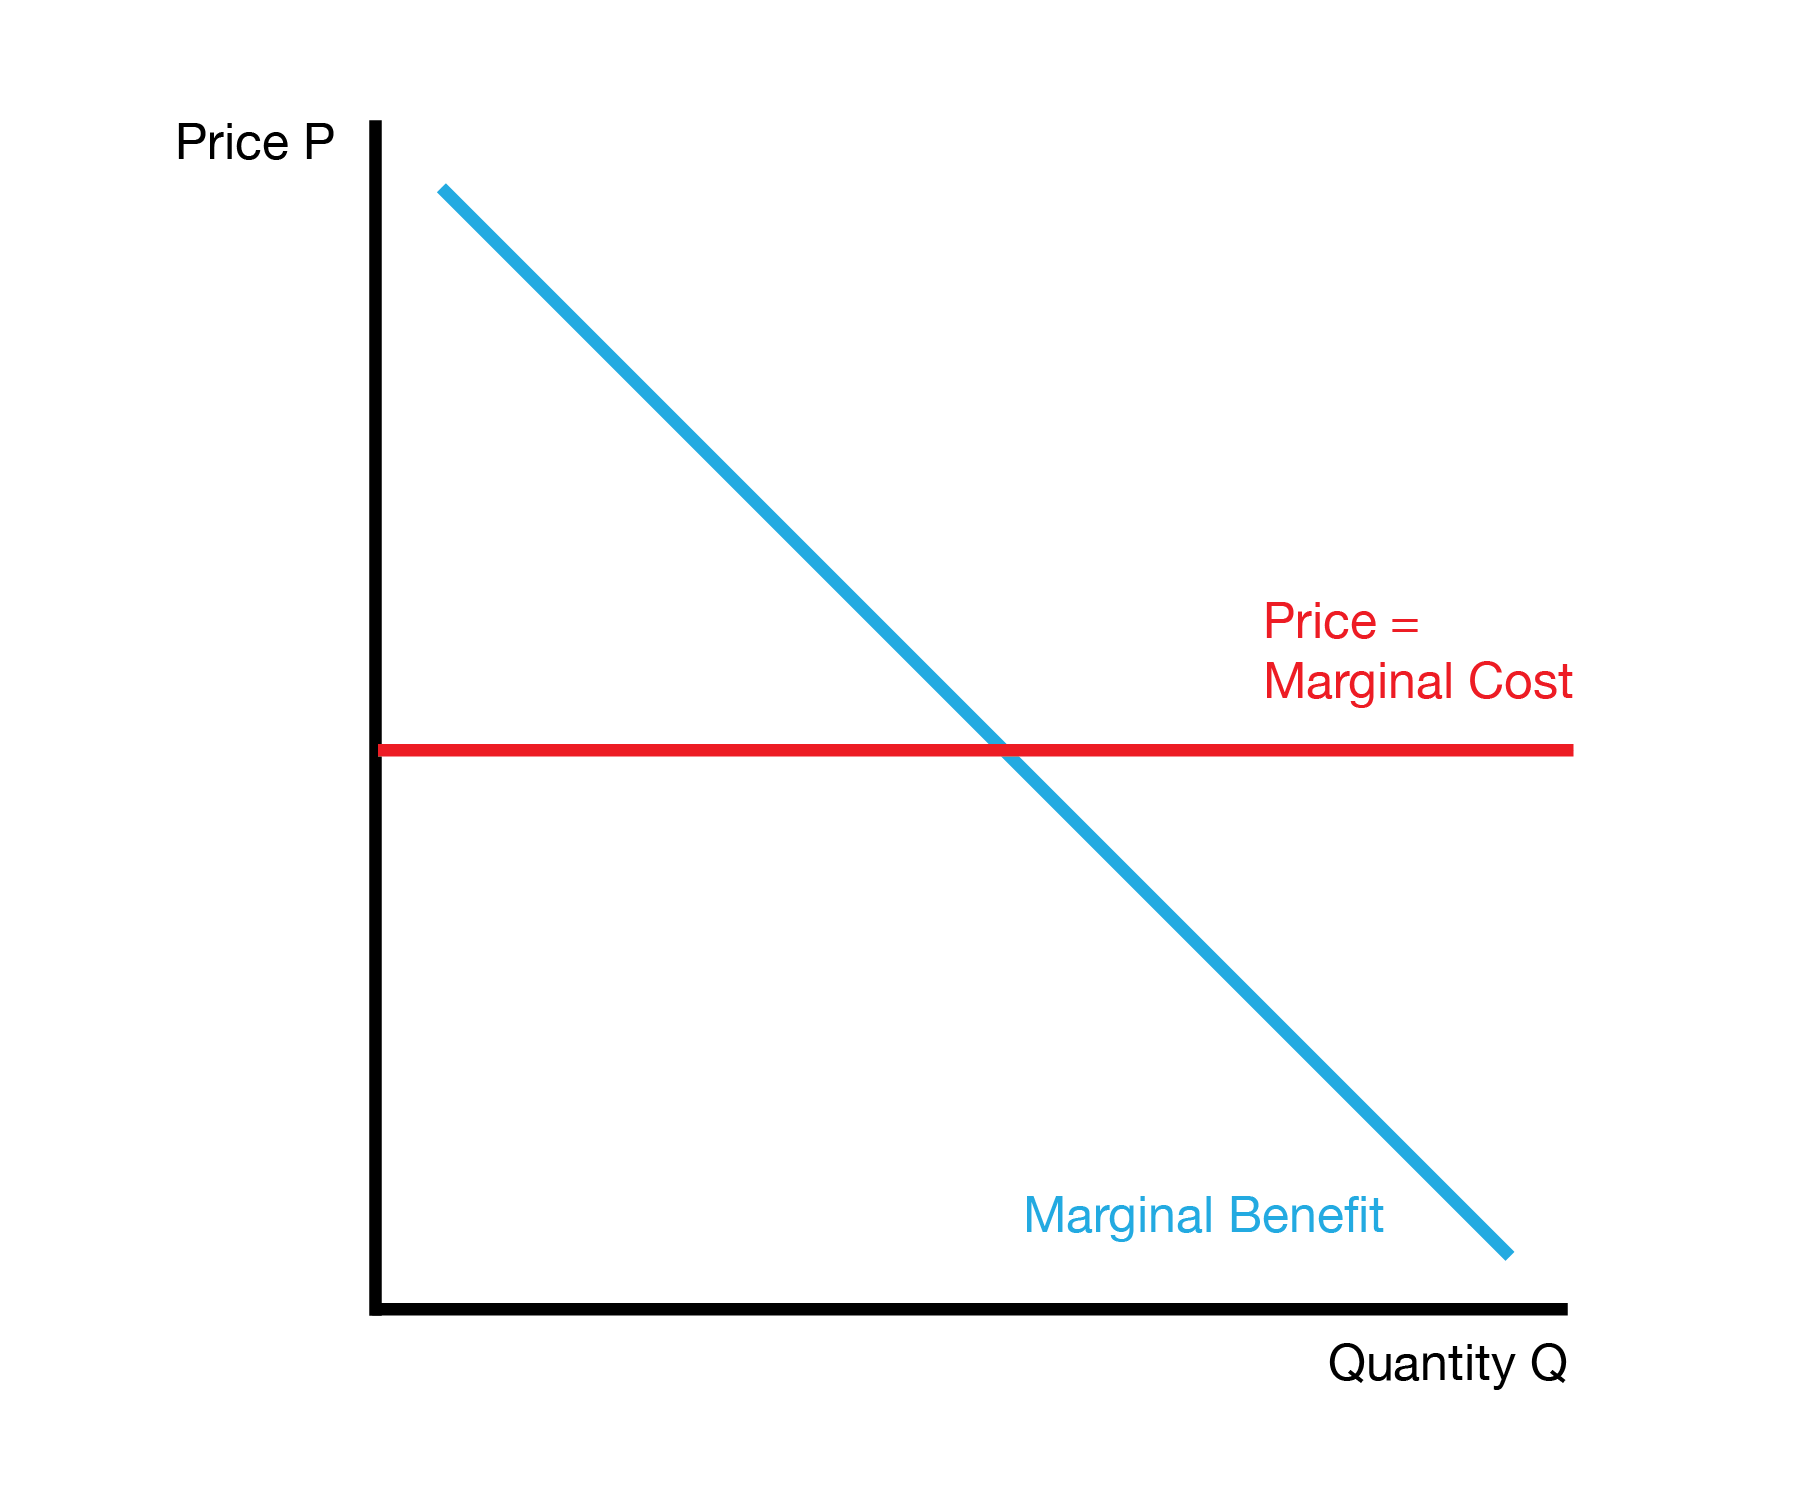
Does this matter? Yes. The marginal benefit curve tells us how much someone benefits from something. When we start computing how ‘happy’ people are, this tells us that we can simply use the demand curve, which is far easier to observe in the data.
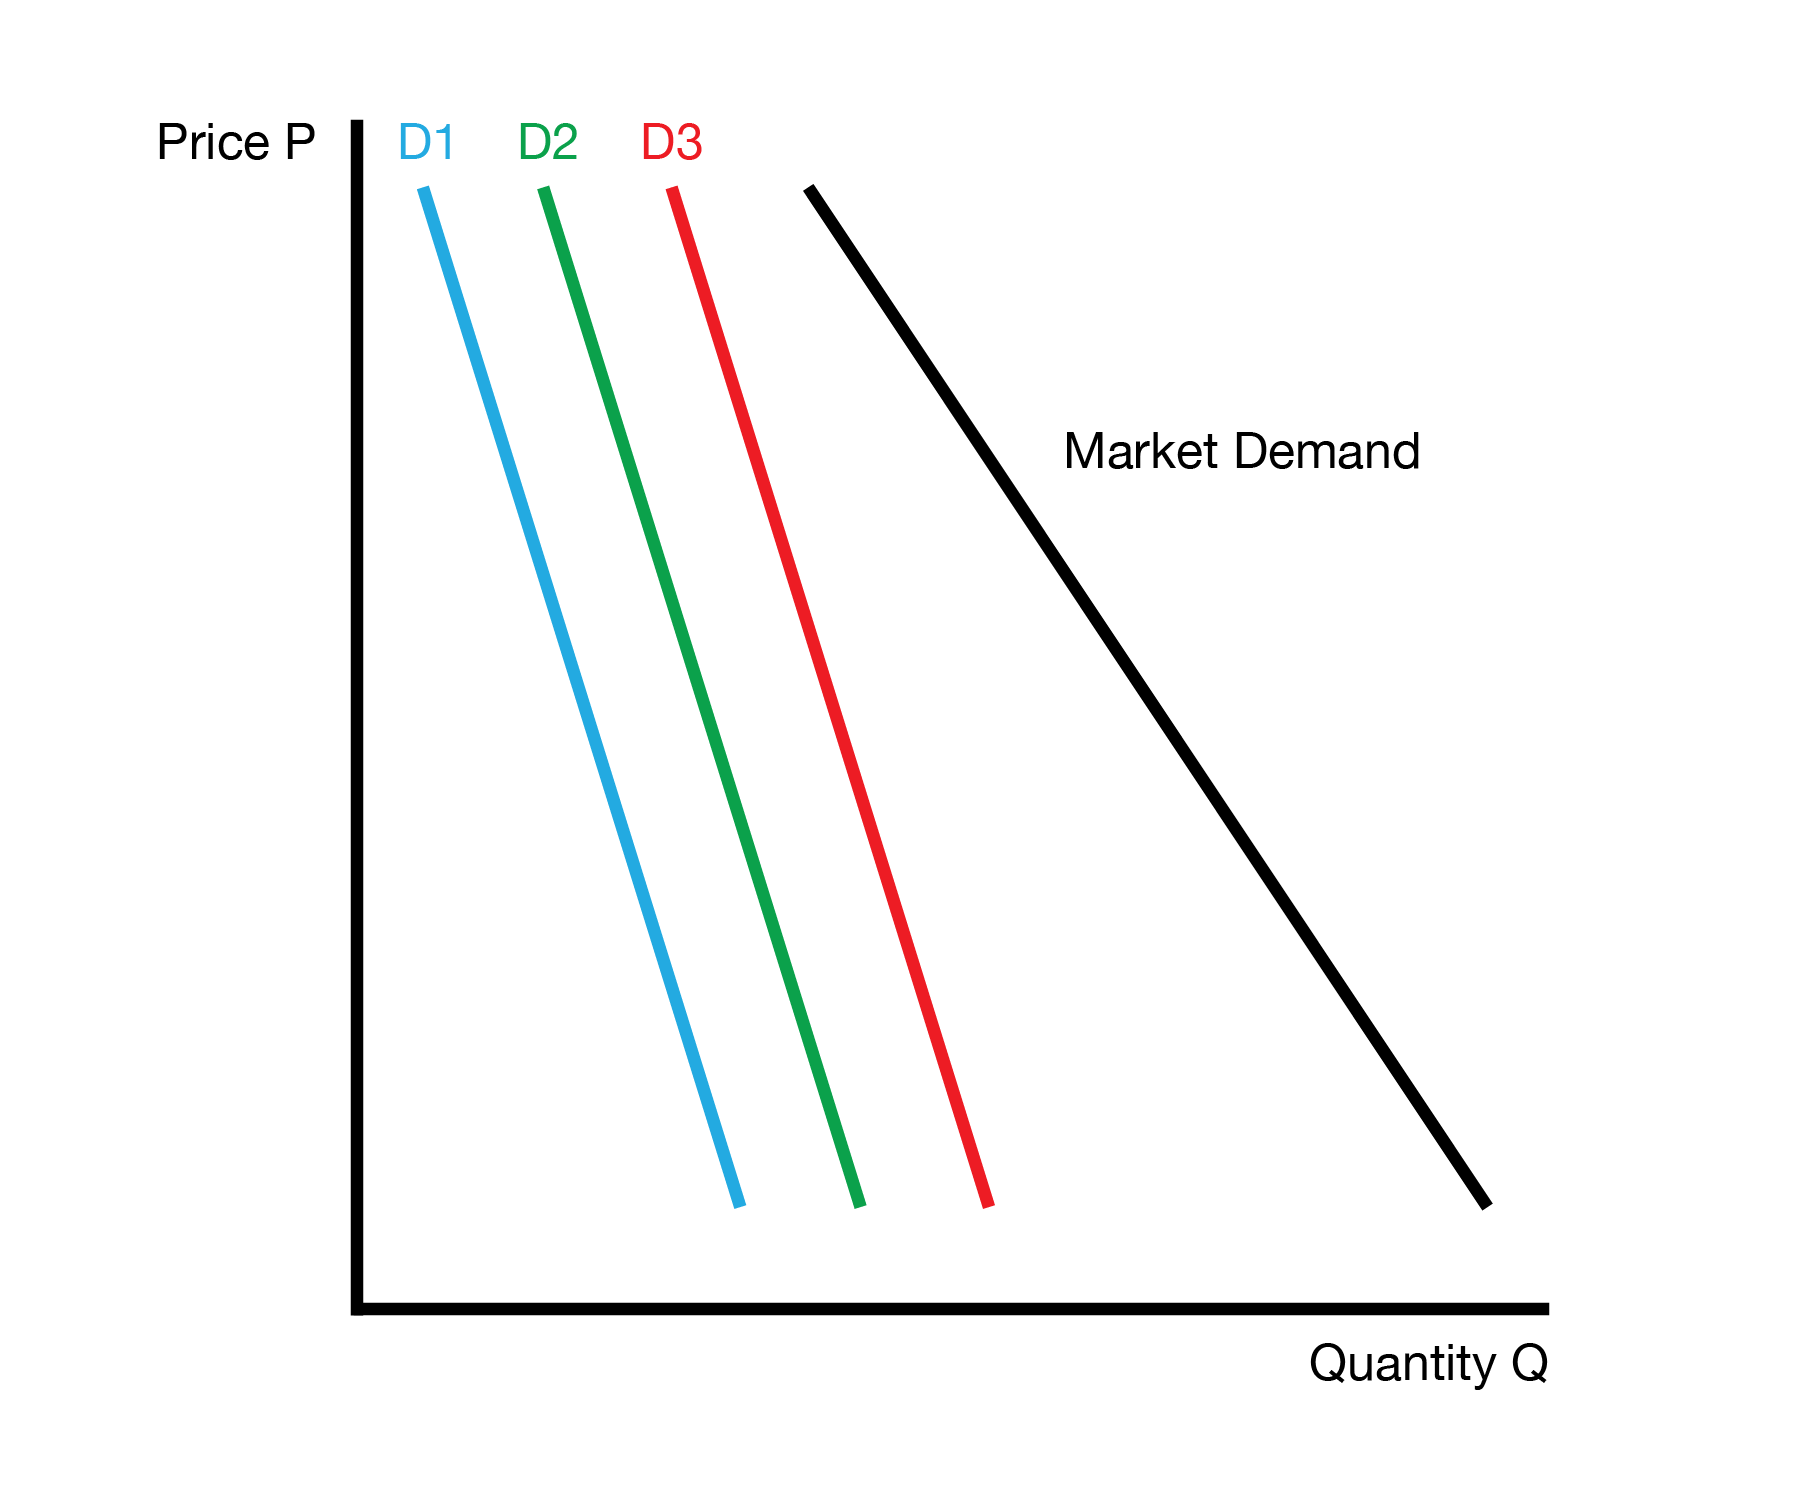
2.5 Market Demand Curve
If we’re working at a firm, we might want to know the total demand for our product, not just the demand of a single person. We compute the market demand by simply adding the demand curves of all the individual consumers in the market. The only catch is that we need to add the quantities demanded at each price, e.g. we need to add horizontally, not vertically.
We can see this in the following example :
| Price | D-Harry | D-Sally | D-Jessy | D-Market |
|---|---|---|---|---|
| 20 | 0 | 0 | 2 | 2 = 0 + 0 + 2 |
| 15 | 0 | 1 | 3 | 4 = 0 + 1 + 3 |
| 10 | 3 | 2 | 4 | 9 = 3 + 2 + 4 |
| 5 | 5 | 4 | 5 | 14 = 5 + 4 + 5 |
Graphically, we can interpret the market demand curve as the horizontal sum of each individual demand curve.
2.6 Conclusion
- This lecture studies the demand curve of the consumer problem
- The demand curve isolates the relationship between the price and quantity demanded, holding everything else constant
- Changes in things other than the price (everything else) lead to demand shifts
- We show the demand curve is equal to the marginal benefit curve and how to compute the market demand curve